
This is a brief overview of my paper “Information Retrieval Performance Measurement Using Extrapolated Precision,” which I’ll be presenting on June 8th at the DESI VI workshop at ICAIL 2015 (slides now available here). The paper provides a novel method for extrapolating a precision-recall point to a different level of recall, and advocates making performance comparisons by extrapolating results for all systems to the same level of recall if the systems cannot be evaluated at exactly the same recall (e.g., some predictive coding systems produce a binary yes/no prediction instead of a relevance score, so the user cannot select the recall that will be achieved).
High recall (finding most of the relevant documents) is important in e-discovery for defensibility. High precision is desirable to ensure that there aren’t a lot of non-relevant documents mixed in with the relevant ones (i.e., high precision reduces the cost of review for responsiveness and privilege). Making judgments about the relative performance of two predictive coding systems knowing only a single precision-recall point for each system is problematic—if one system has higher recall but lower precision for a particular task, is it the better system for that task?
There are various performance measures like the F1 score that combine precision and recall into a single number to allow performance comparisons. Unfortunately, such measures often assume a trade-off between precision and recall that is not appropriate for e-discovery (I’ve written about problems with the F1 score before). To understand the problem, it is useful to look at how F1 varies as a function of the recall where it is measured. Here are two precision-recall curves, with the one on the left being for an easy categorization task and the one on the right being for a hard task, with the F1 score corresponding to each point on the precision-recall curve superimposed:
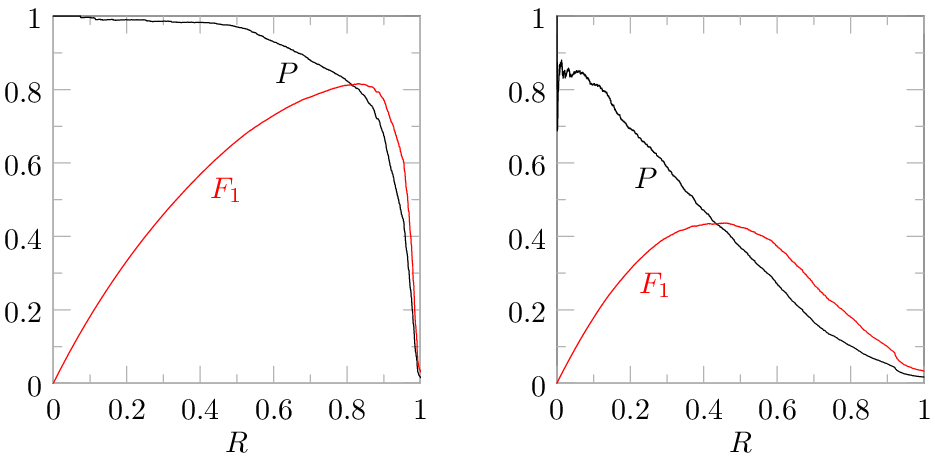 If we pick a single point from the precision-recall curve and compute the value of F1 for that point, the resulting F1 is very sensitive to the precision-recall point we choose. F1 is maximized at 46% recall in the graph on the right, which means that the trade-off between precision and recall that F1 deems to be reasonable implies that it is not worthwhile to produce more than 46% of the relevant documents for that task because precision suffers too much when you push to higher recall. That is simply not compatible with the needs of e-discovery. In e-discovery, the trade-off between precision (cost) and recall required should be dictated by proportionality, not by some performance measure that is oblivious to the value of the case. Other problems with the F1 score are detailed in the paper.
The strong dependence that F1 has on recall as we move along the precision-recall curve means that it is easy to draw wrong conclusions about which system is performing better when performance is measured at different levels of recall. This strong dependence on recall occurs because the contours of equal F1 are not shaped like precision-recall curves, so a precision-recall curve will cut across many contours. In order to have the freedom to measure performance at recall levels that are relevant for e-discovery (e.g., 75% or higher) without drawing wrong conclusions about which system is performing best, the paper proposes a performance measure that has constant-performance contours that are shaped like precision-recall curves, so the performance measure depends much less on the recall level where the measurement is made than F1 does. In other words, the proposed performance measure aims to be sensitive to how well the system is working while being insensitive to the specific point on the precision-recall curve where the measurement is made. This graph compares the constant-performance contours for F1 to the measure proposed in the paper:

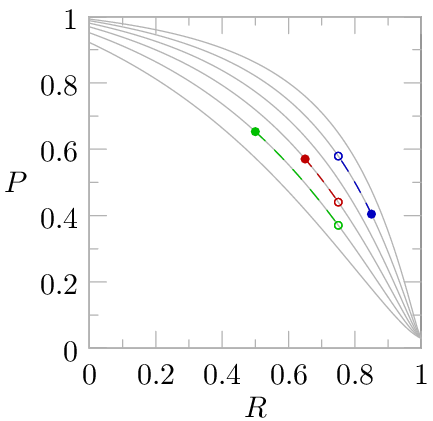
Since the constant-performance contours are shaped like typical precision-recall curves, we can view this measure as being equivalent to extrapolating the precision-recall point to some other target recall level, like 75%, by simply finding an idealized precision-recall curve that passes through the point and moving along that curve to the target recall. This figure illustrates extrapolation of precision measurements for three different systems at different recall levels to 75% recall for comparison:
Finally, here is what the performance measure looks like if we evaluate it for each point in the two precision-recall curves from the first figure:

The blue performance curves are much flatter than the red F1 curves from the first figure, so the value is much less sensitive to the recall level where it is measured. As an added bonus, the measure is an extrapolated estimate of the precision that the system would achieve at 75% recall, so it is inversely proportional to the cost of the document review needed (excluding training and testing) to reach 75% recall. For more details, read the paper or attend my talk at DESI VI.


